
Global PEFA scores are not improving. Is that a problem?
by Philipp Krause, Paolo de Renzio, Avani Kapur, Edward Hedger
Public finance matters, arguably more so in 2026 than before. Many low- and middle-income countries are navigating tighter fiscal space, rising debt pressures, and increasing demands on public spending. At the same time, the development finance landscape has shifted, with greater emphasis on domestic resource mobilization and on the effectiveness—rather than simply the integrity—of public spending. These shifts raise questions about how public finance systems can contribute to ensuring that public resources are managed responsibly and effectively. They should also force the expert community to ask again how public finance systems can best be assessed and whether existing diagnostic tools are still fit for purpose.
The Public Expenditure and Financial Accountability (PEFA) framework has, for nearly two decades, served as the primary instrument for assessing the quality of public financial management systems across countries. A recent analysis by the PEFA secretariat (itself an update on an earlier take from 2023) suggests that PFM performance, as measured by PEFA scores, has improved moderately since 2005, and that the use of PEFA itself can be associated with these improvements.
We take a closer look at these claims and argue that this is problematic for three reasons: First, the PEFA dataset does not suggest that PEFA scores have been improving in any meaningful way. Second, it is not clear that repeated PEFA assessments leadto improved scores. Third, and most fundamentally, PEFA scores are not necessarily a good proxy for “PFM performance”, and certainly do not tell us much about fiscal performance.
Let’s take these in turn:
The PEFA dataset does not suggest that PEFA scores have been improving in any meaningful way.
This requires some unpacking. PEFA purports to measure PFM performance through a set of indicators (currently 31). Each indicator is scored using US school marks, where A is best and D is worst. The PEFA framework is not an index, so there is no special method for aggregating individual indicators into a single country score. Its stated purpose is to track progress within countries across specific dimensions, not to generate cross-country comparisons or global trends.
Rather unsurprisingly, researchers seized upon PEFA as a best-available proxy for PFM performance, including for cross-country comparisons. It has since become the accepted approach to convert the letter grades into numerical scores (A=4, B=3 and so on), average numerical scores across indicators, and use these average scores as proxies for the quality of PFM systems across countries and over time, used in research investigating both its causes and consequences.
The analysis presented by the PEFA Secretariat takes all the PEFA assessments carried out in each year from 2005 to 2024, calculates the average PEFA score for each country assessed, and then looks at how the average across countries shifts over time. However, extrapolating from average annual PEFA scores runs into several problems.
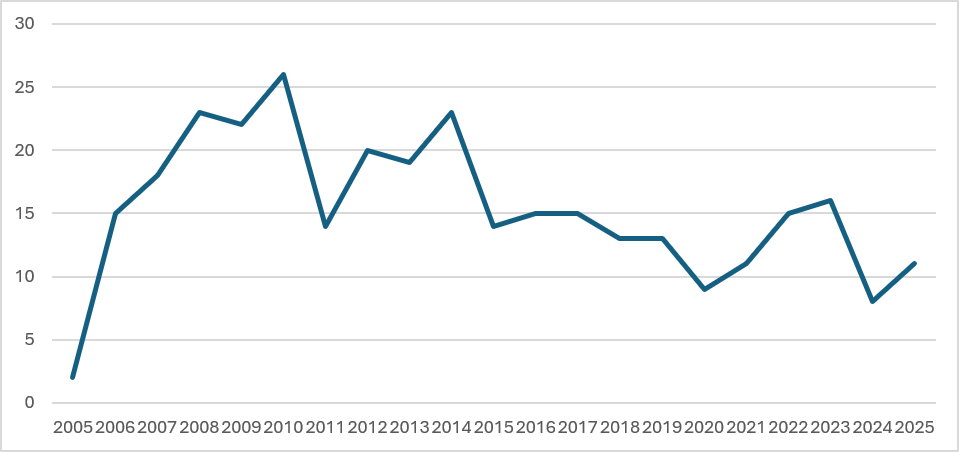
First, the annual number of PEFA assessments is quite small, typically between 10-20 new national assessments and varies considerably from year to year. In each year, there are only about 10-20 new national assessments. Most of these are funded, and advocated for, by different donor agencies. High-income countries don’t carry out PEFA national assessments, with only a handful of exceptions (such as Norway, one of the founding partners of PEFA, which assessed itself early on in 2008). Realistically, there are about 120-130 LMICs that could be expected to be potential PEFA countries, most of which have done at least one assessment already. So randomness might yield a high proportion of low-income countries in one year and a much smaller number the next. Given the well-established correlation between income levels and PEFA scores, a year with more low-income countries will tend to show lower averages, and vice versa. Furthermore, the number of national assessments has also been falling steadily after its peak in 2010 (see Figure 1). The average since 2020 has been about 12 per year, so annual averages are becoming less meaningful.
Figure 1: Number of National PEFA Assessments per Year 2005-2025
Source: authors
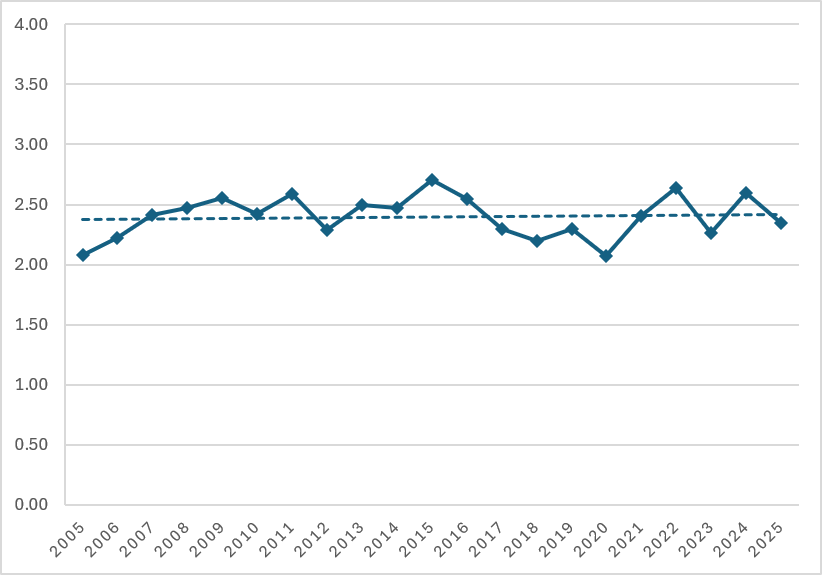
Second, the trend in global average scores is highly sensitive to how the data are aggregated. The blog authors claim that “average PEFA scores increased moderately during the period 2005 to 2024”. This claim seems based on the ever so slightly positively sloped linear trendline shown in the post and reproduced in Figure 2. The exact annual averages differ slightly, but the slope is 0.003 for 2005-2024, and 0.0019 if 2025 is included. Taking into account Figure 1, it should be noted that the two assessments done in 2005 (Zambia, 2.25 and Afghanistan 1.91) are doing as much work for the overall improving trend as the 26 assessments done in 2010. This is problematic.
Figure 2: Annual Average National PEFA Scores 2005-2025
Source: authors
Looking at the whole dataset (n=322), there is virtually no linear relationship between scores and time (R=-0.028). This is itself a very interesting observation that bears further analysis. But whatever it is that PEFA scores measure, the scores are quite persistent over time.
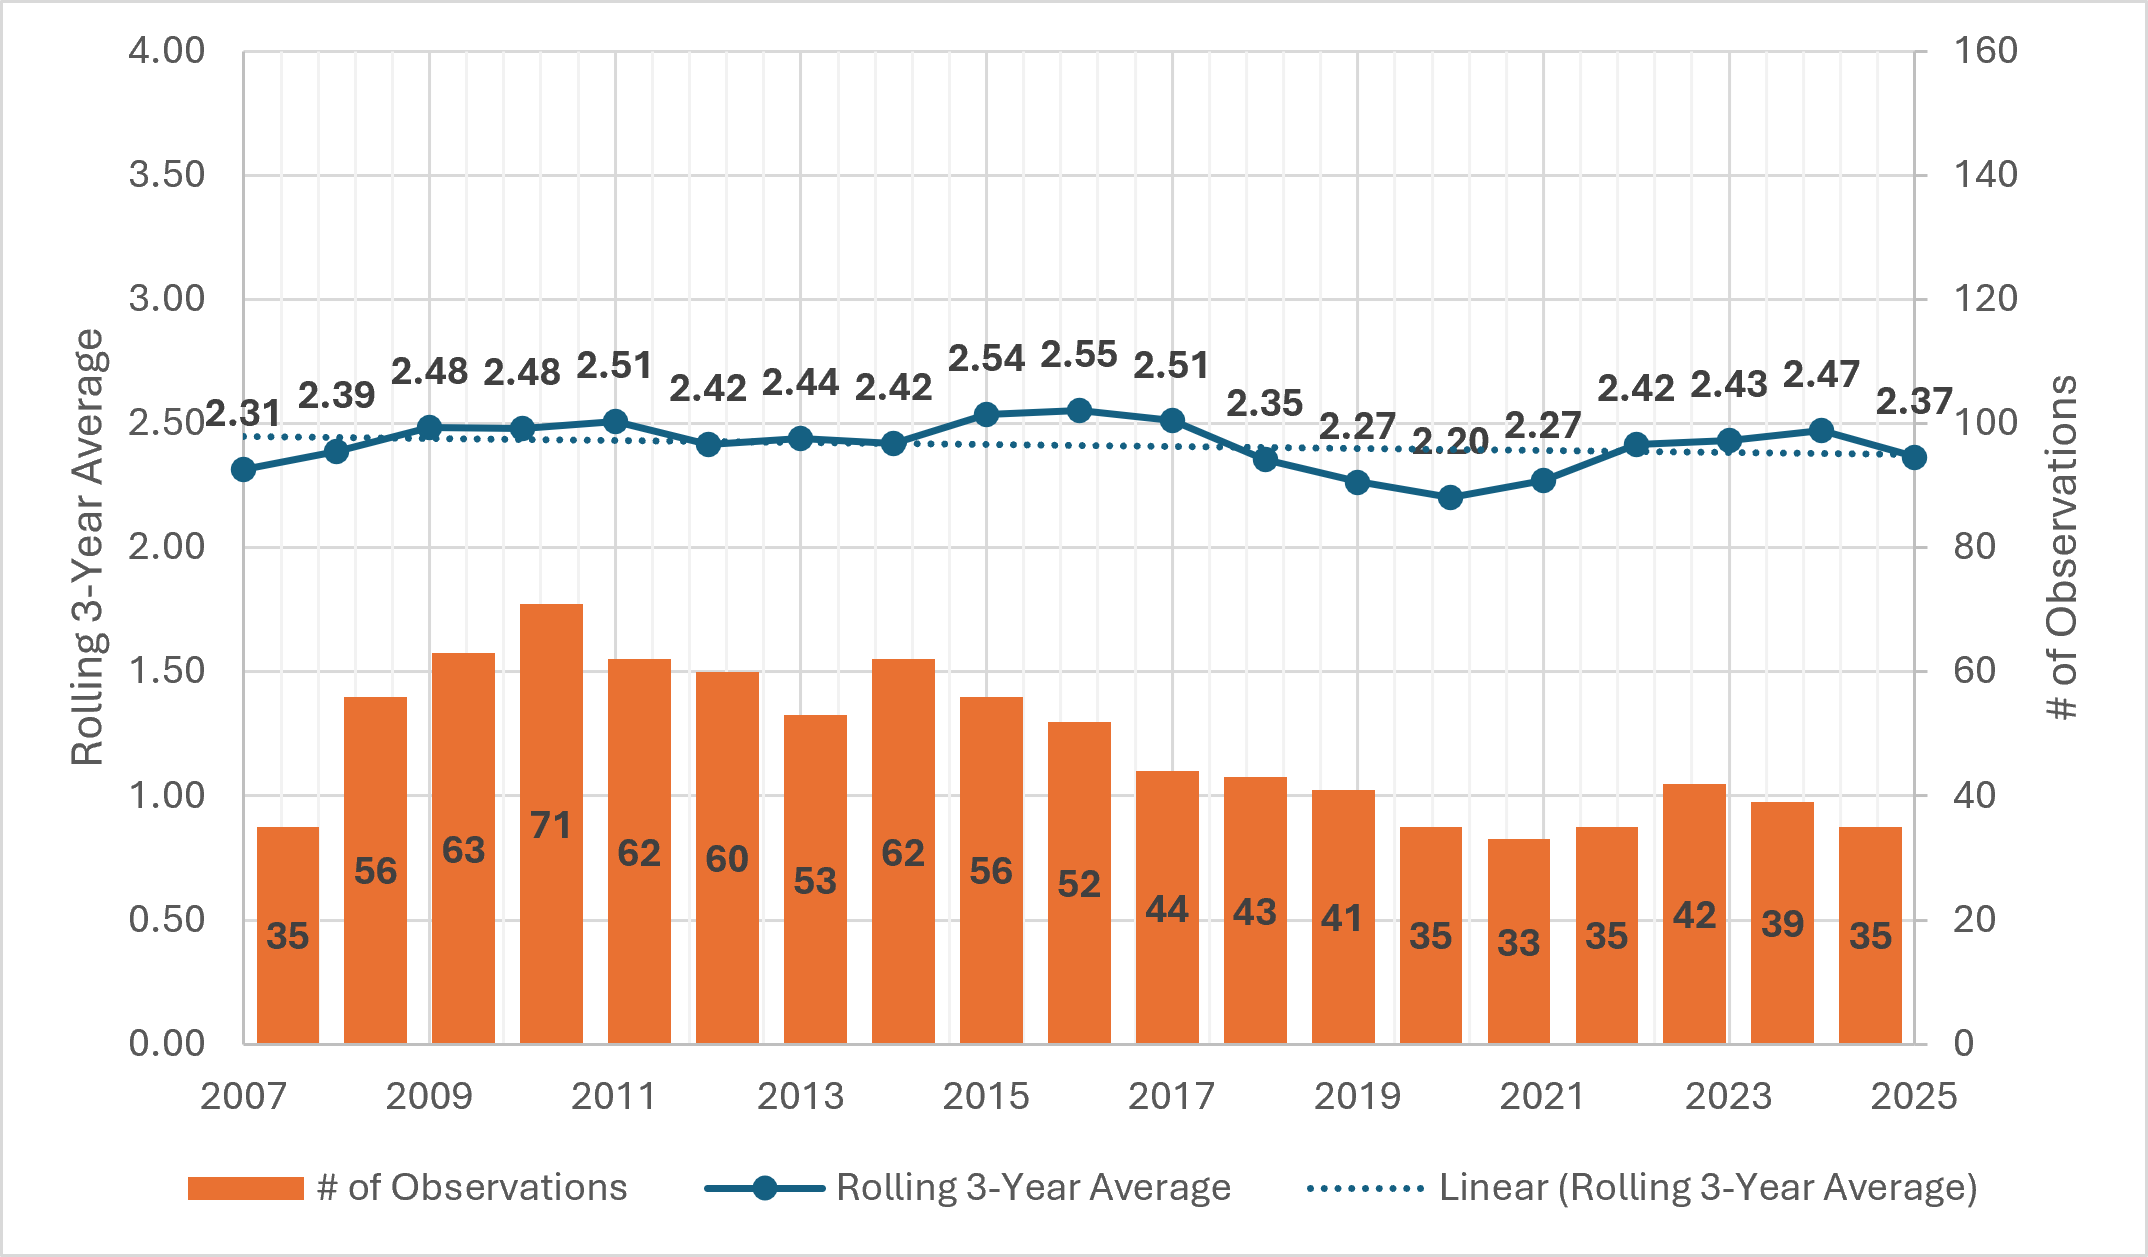
There are several ways to reduce the small sample problem and still visualize developments over time, for instance by grouping together slightly larger sets for each average. One is to calculate the rolling 3-year average of the last three years in each year, starting with 2007 (Figure 3). Now the number of observations per average ranges from 33 to 71 instead of 2 to 26. With the random spikes thus somewhat smoothed out, the slope turns from very slightly positive to slightly negative (-0.0041).
Figure 3: National PEFA Scores, Rolling 3-Year Average 2007-2025
Source: authors
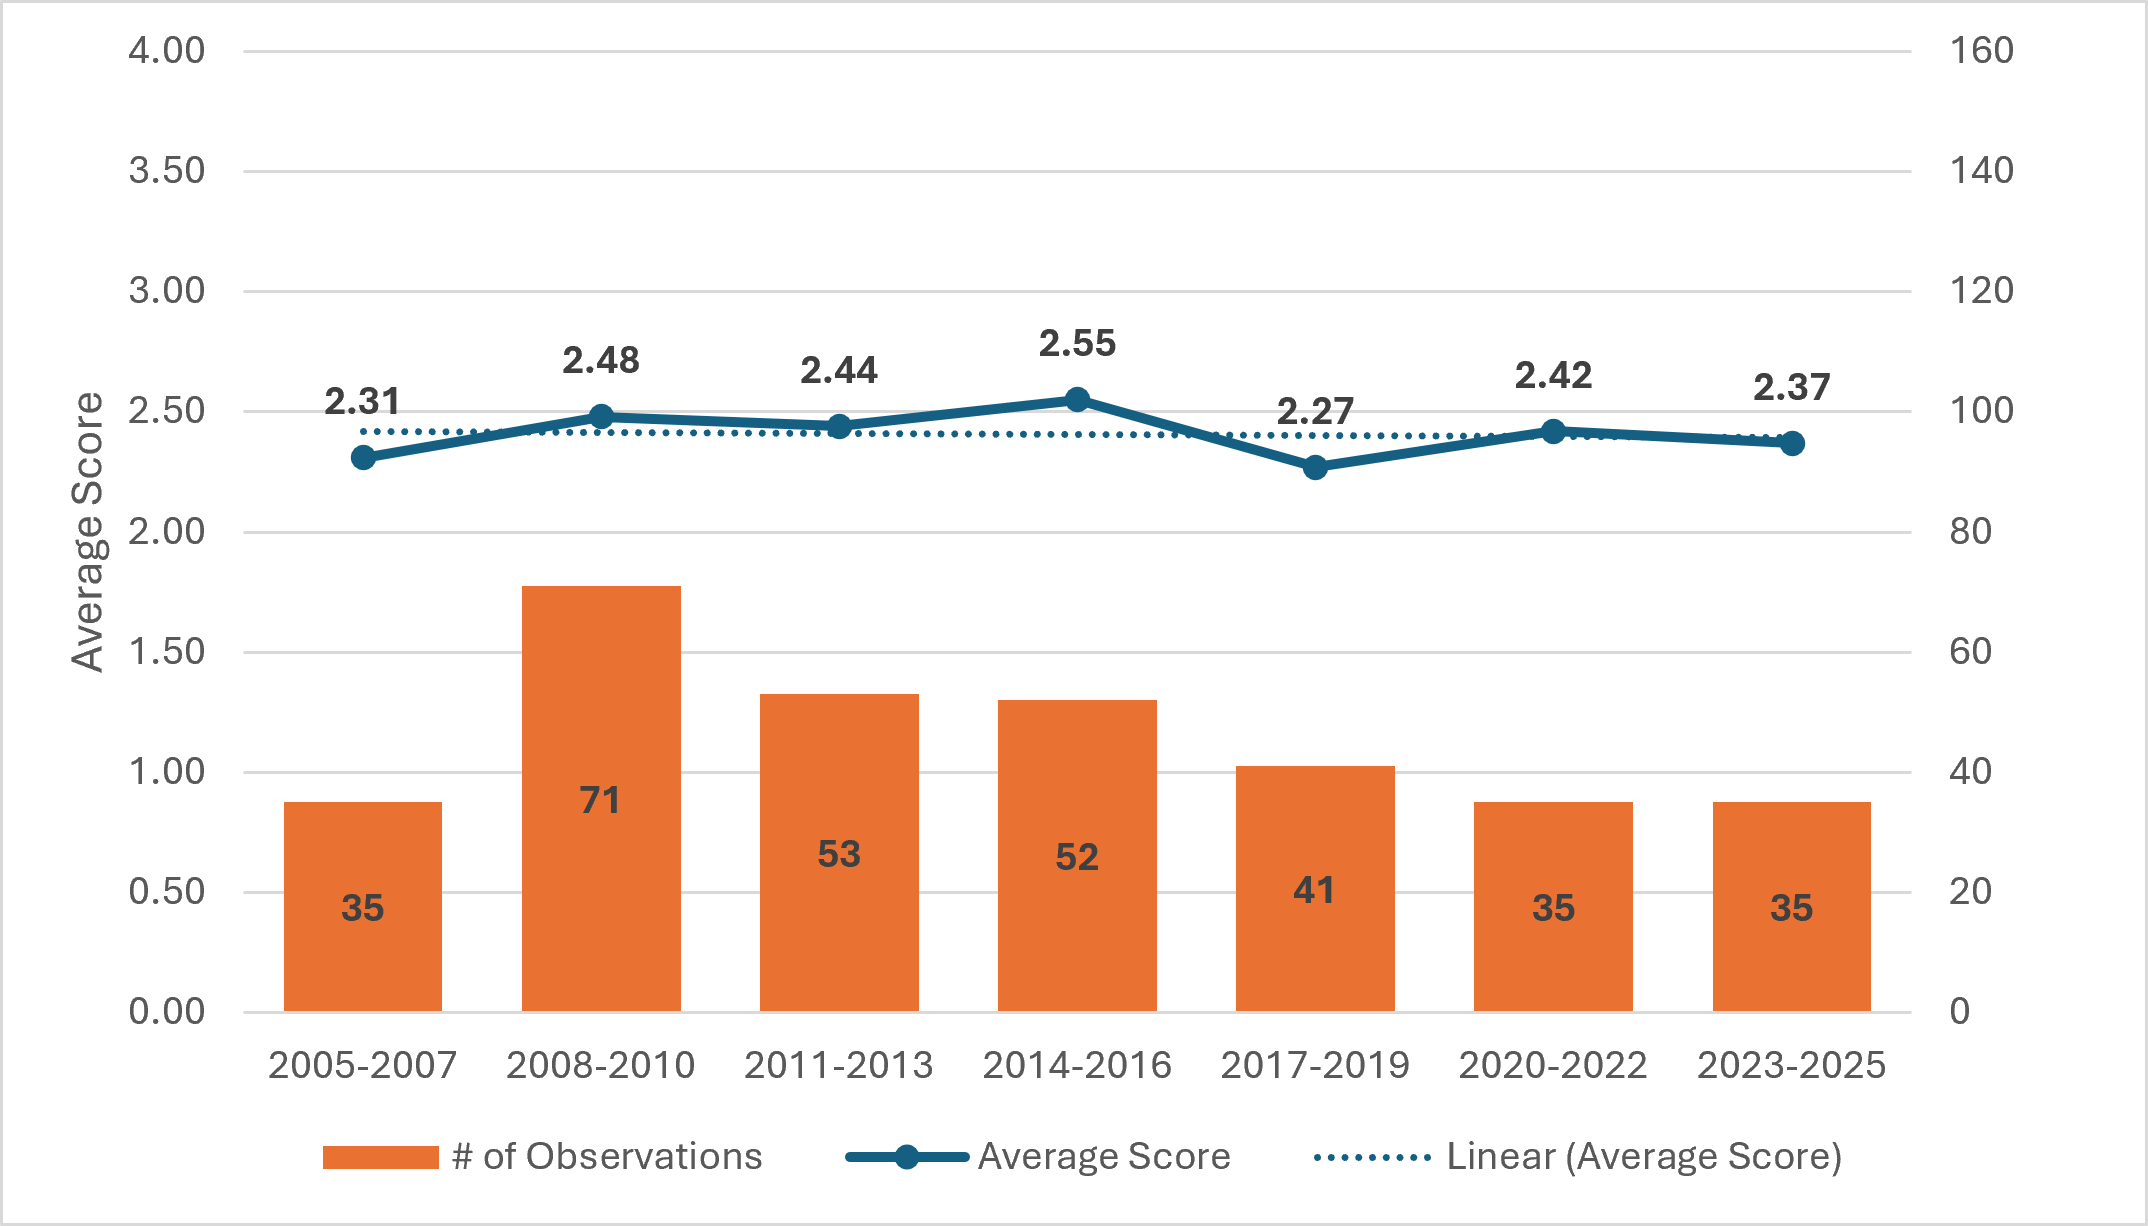
Figure 4: Average National PEFA Scores, 3-Year Buckets 2005-2025
Source: authors
Instead of a rolling average, one could also use 3-year buckets, or 5-year buckets (adding up years so that each observation is only used once). It makes little difference. The variation is always small and the trend is always slightly negative.
If there was any conclusion to be drawn from the two-decade trend, it would either be that PEFA scores never improved, or that they stalled and started to slowly decline about a decade ago. More appropriately, the conclusion should be that there is no meaningful trend over time. Most countries cluster in a very narrow band between 2.3 and 2.5 without much change.
It is not clear that PEFA assessments lead to improved scores.
A related question is whether PEFA assessments contribute to improved PFM. PEFA was originally conceived as an assessment for PFM performance and was not to be taken as a template for reform priorities or sequencing. Reports make no recommendations nor do they evaluate the likely impact of the government’s reform plans. Until 2016, the framework foresaw something called the “Strengthened Approach” to supporting PFM reforms, which was to consist of “(i) a country led PFM reform strategy and action plan, (ii) a coordinated IFI-donor integrated, multi-year program of PFM work that supports and is aligned with the government’s PFM reform strategy and, (iii) a shared information pool”. The PEFA assessment would contribute to the third element. Although the Strengthened Approach was eventually abandoned, the original framing highlighted how the PEFA assessment itself would play only a minor role contributing to government-led reforms.
Of course, proponents and opponents of the PEFA approach were not slow to note that in practice, PEFA was exactly becoming a template for PFM reform, and that both funding and technical support aligned with the scoring. Matt Andrews already pointed out the limitations of this approach in 2010. The subsequent debate is both voluminous and well-known. For others, the limitations were the point. With PEFA, the path forward is clear, and since PEFA is a comprehensive PFM performance assessment, what isn’t in PEFA isn’t PFM. Hence, the EU commission noted at the PEFA program’s latest renewal, “PEFA is at the heart of the EU’s cooperation with many partner countries”. A former head of the PEFA secretariat explained in a 2017 post that “[PEFA users] see the implications of the overall performance results on the seven key pillars of PFM performance”. In other words, PEFA scores today tell you which PEFA scores to improve tomorrow, and since PEFA scores equal PFM performance, further assessments are needed to track reform implementation and success.
It is against this backdrop that PEFA publications have been paying increasing attention to score changes between repeat assessments in the same country (in addition to the global averages). Changes in score are important information, especially to decisionmakers in government. Since so much support is targeted towards improving PEFA scores, finance ministries will want to know whether reforms worked on their own terms. Especially in low income countries where aid flows are linked to PEFA as an instrument to allay fiduciary concerns, scores matter. However, the evidence on this question is also ambiguous.
The original version of an online publication by the PEFA secretariat (headlined the “Global Report on PFM 2022”), tracked the average scores of repeat assessments done in 93 countries under the 2011 framework. It showed that average scores improved in 53 countries between the first and last assessment, of which only 23 improved by more than 0.5 points, the equivalent of a change from C to C+. It also showed that they decreased in 30 countries, and that in 10 countries they stayed the same.
Using the full dataset of all publicly available national assessments, we find a total of 94 countries with repeat assessments between 2005 and 2025. Out of these, 35 improved, 44 worsened, and 15 remained the same (within +/- 0.05 in score). 12 countries achieved an average improvement of at least 0.5. Two countries improved by a full point (as a C to a B; these are Georgia and Kyrgyz Republic). Looking at only the 2016 framework, the picture is more positive. 31 countries had repeat assessments, 21 improved, 5 worsened, 5 held steady. Among the improvers, only Togo improved by at least 0.5 points, but over a much shorter period.
What do these observations tell us? Again, the answer is probably not much. Instead they reinforce a familiar finding from academic literature on fiscal institutions that profound and sustained institutional change is rare, slow and difficult to sustain. Each case deserves closer study. What exactly happened in Togo between 2016 and 2023? Will the change last and maybe even improve further? Reports should be written about it. But did Georgia need four assessments between 2008 and 2022 for its reforms to succeed? Or was Georgia happy to be assessed on a regular basis, because officials knew their much broader reforms were succeeding and they appreciated the stamp of approval that improved PEFA scores bestowed? After all, the OECD describes Georgia’s entire structural, economic and regulatory reforms as “nothing short of remarkable”. If PEFA assessments contributed to Georgia’s improved scores, did five PEFA assessments over 15 years also influence Mozambique’s decrease of half a point between 2006 and 2021?
PEFA scores are not necessarily a good proxy for PFM performance and do not tell us much about fiscal performance.
Is it a problem that global PEFA scores are not improving? Donor officials sometimes imply (for instance here and here) that if PEFA scores are not improving, PFM reforms are not succeeding, and thus investing in PFM expertise and technical assistance is poor value for money. Not necessarily so. Reforming governments may simply prioritize a few areas in their reforms or time their efforts in ways that do not align with the indicators emphasised in external assessments. There is no evidence to suggest that governments are losing their appetite for better PFM. And there is no evidence to suggest that investing in public finance institutions is a worse (or better) deal than other forms of long-term institutional strengthening. In fact, given how essential public finance institutions are to a functioning government, there is no serious way around them. In short, trends in global PEFA scores should not be used to pass judgement on the importance or the value of PFM and PFM reforms.
The trends in PEFA scores still merit consideration. It is not helpful to gloss over the fact that the global average has barely moved in two decades. PEFA is, after all, an instrument that came into its own by the demand for a quasi-fiduciary assessment created by budget support. It never gathered interest from high-income countries and thus never became a “global” instrument. Trying to maintain the impression that global “PFM performance” is improving based on selected patterns in the PEFA data is not helping our understanding of PFM dynamics. A more interesting effort could be to better understand the details of substantial improvements or deteriorations in PEFA scores for specific countries over time. A more nuanced analysis might also reveal how some PFM areas are more amenable to reforms, a question dear to PFM reformers. Hopefully this discussion will continue.
More importantly still, the world has changed dramatically since 2005. Much better ways of tracking and analyzing public sector institutions have since become available. Perhaps it’s time to have a serious conversation about what diagnostic tools would be fit for the present moment, and what would be gained (and lost) from moving beyond PEFA.